Benefits
Better Information Means Better Decision-Making
- Each field has its own report.
- Square sheds alert growers to pest problems and augment insect scouting reports.
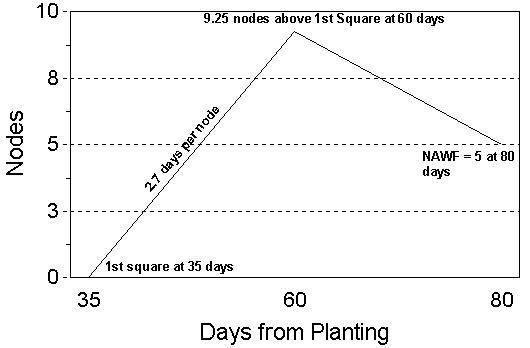
- A quick comparison to the Target Development Curve tells if crop pace is too fast or right on track for a high and early yield.
See the University of Arkansas Division of Agriculture Publication,
Interpretation of Crop Growth Patterns Generated by COTMAN, Special Report 181.
- Crop Curves can indicate if stress is occurring.
Takes out End-of-Season Guess-Work
- When bolls are safe from fruit-feeding insects.
- When to defoliate for optimum yields and quality.
COTMAN is Easy to Use
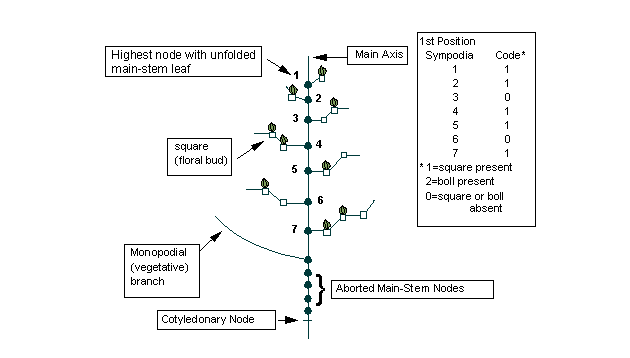
- At first square, plant stand counts and average first fruiting node are recorded.
- From first square to first flower, ten plants at each of four sites per field are monitored weekly for the presence or absence of first-position squares.

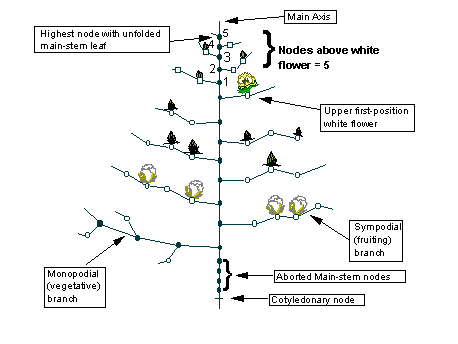
- From first flower until cutout, nodes-above-white-flower (NAWF) counts are recorded weekly from ten plants at each of four sites per field.

- From cutout until defoliation, daily high and low temperatures are recoded from a local weather source.
COTMAN Provides Timely Information
- Plant and fruit numbers per acre
- Graph of crop developmental pace
- Flowering date of the last effective boll population
- Dates when bolls are safe from damage by fruit-feeding insects - boll weevils, tobacco budworms, plant bugs and bollworms
- Dates when crop is ready for defoliation
COTMAN is Profitable
- The cost of full-season crop monitoring is more than offset by savings on the late-season insecticide
- Timely feedback on crop development pace and stress give growers potential to...
- Take prompt corrective action
- Integrate management systems
- Meet objective of overall profitability
|


